ROAS from 111 % to 560 %: a home accessories e-shop
A small home-accessories e-shop case: splitting the assortment into five groups, two campaigns by performance and excluding products under 300 Kč.
A small e-shop with home accessories, which is a side project of our client.
It is not an e-shop that feeds him — it serves rather as extra income. That is why we did not chase huge numbers, but focused above all on the performance of the ads.
Over 8 months we managed to improve significantly not only the efficiency of the campaigns, but also to increase revenue, the number of orders and the average order value.
About the e-shop
A home accessories e-shop (Czech Republic)
- Category: Home accessories
- Size: growth from 30–50 to 50–250 orders per month
- Assortment: 4000 SKU
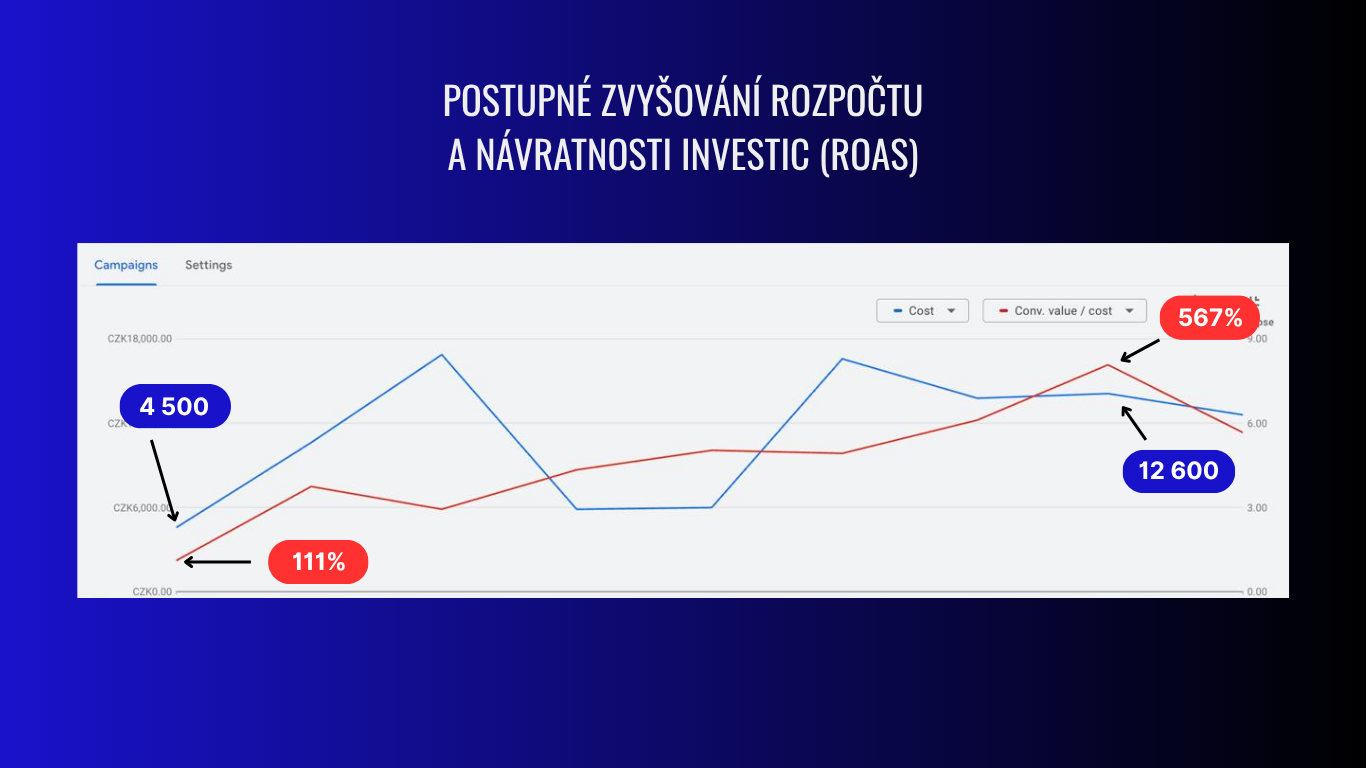
This case is unique in that we worked with very small budgets, which significantly slowed down the collection of the data needed for optimisation. Even so, we managed to gradually raise the efficiency of the advertising campaigns and increase the budget at the same time.
We achieved the best results in December — ROAS exceeded 800 % and the number of orders reached a record 110.
How we increased the efficiency of the campaigns
The first step was an analysis of the assortment and of the Google Ads account.
Based on the data we identified products that rather drive up the cost of the advertising than bring results. We excluded those and split the rest of the assortment by performance.
Other important steps:
- Analysis of every product
- Structure of the advertising campaigns
- Creating new segments by price
- Optimisation of the campaigns
Analysis of every product
Based on our algorithm we analyse every product in the advertising and split the assortment into five groups:
- Bestseller
- Potential bestseller
- Zombie
- Loser
- New arrivals
This step is essential for the further distribution of the budget based on the results of the individual items.
Products that bring sales and work efficiently are the ones we want to support by increasing impressions, clicks and sales.
Conversely, for items that “eat” our budget but do not bring the required results, we lower both the priority and the funding.
Structure of the advertising campaigns
Based on the segments we split the assortment into two campaigns:
Campaign no. 1
Goal: maximise the number of conversions and revenue at the target ROAS.
Segments: Bestseller, Potential bestseller and New arrivals.
The campaign contains products that we know sell well, and new products among which we want to discover further bestsellers.
Campaign no. 2
Goal: reduce the cost of products from the Zombie and Loser groups so that they sell profitably.
Segments: Loser, Zombie
We set the target ROAS or higher, so spending grows only when the required efficiency is reached.
This way we distributed the budget better, discovered new bestsellers, increased revenue and improved the efficiency of the campaigns.
Creating new segments by price
After three months of cooperation we found that the average order value was not growing.
Retrospectively, the algorithm showed us that products under 300 Kč significantly lower the AOV and the efficiency of the campaigns.
That is why we set up a rule for segmenting products by price in Google Merchant Center and subsequently excluded products under 300 Kč from the campaigns.
After this step revenue, AOV and the efficiency of the advertising campaigns started to grow.
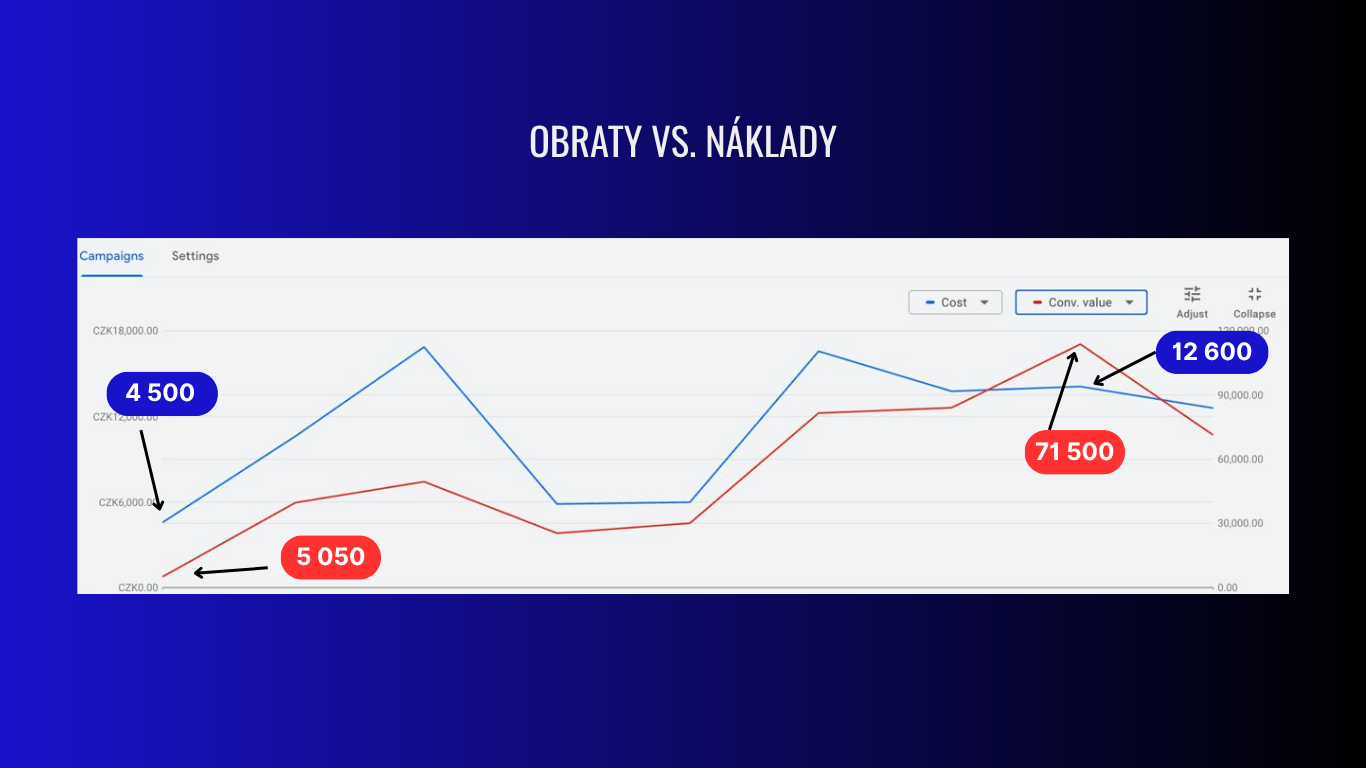
We managed to increase the average order value and ROAS the most thanks to excluding products priced under 300 Kč.
That allowed us to redirect the budget to more expensive items, which made scaling the account more effective.
It is clearly visible on the chart as well.
If your assortment has a wide price spread, we recommend introducing a similar rule based on price so that you can see how the individual segments perform.
We have prepared a detailed guide on how to do it in GMC.
Optimisation
We tested various ways of optimising advertising campaigns in Google Ads.
This procedure for keeping up the momentum proved itself for us:
- Make changes at most once every 3–4 days
- Change ROAS by at most 10 %
- Change the budget by at most 30 %
- Maximum number of assets in one asset group
Because Google works on the basis of:
- demand
- data
- a self-learning algorithm
Any larger change in one of these elements leads to larger deviations in the data:
- Increasing the budget means more clicks, impressions and therefore a bigger data flow
- Changing ROAS changes the conditions for spending the budget
- Changing the number of products in the campaigns adds or removes potential keywords
And above all: big changes can cause Google to “relearn” and lose stability.
Results:
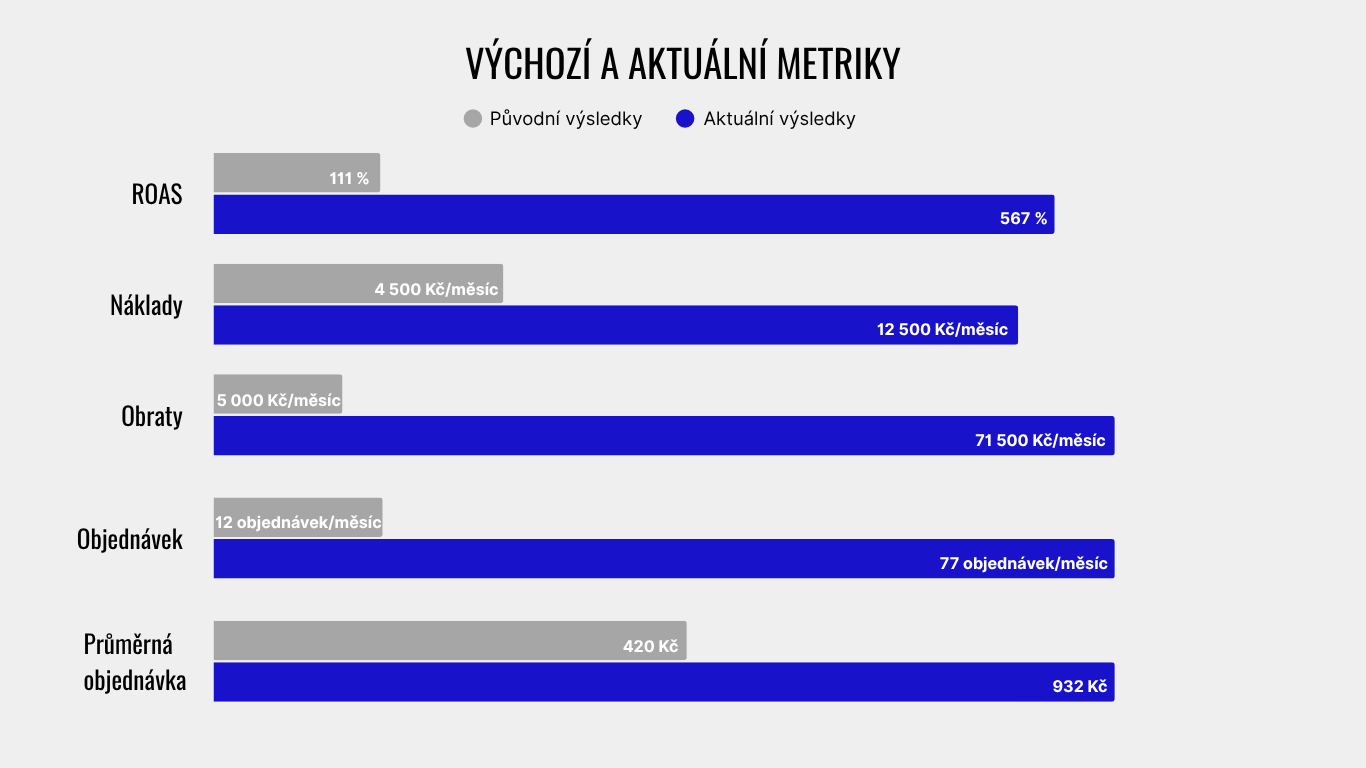
- ROAS: from 111 % to 567 %
- Revenue: from 5,000 to 71,500 Kč/month
- Cost: from 4,500 to 12,500 Kč/month
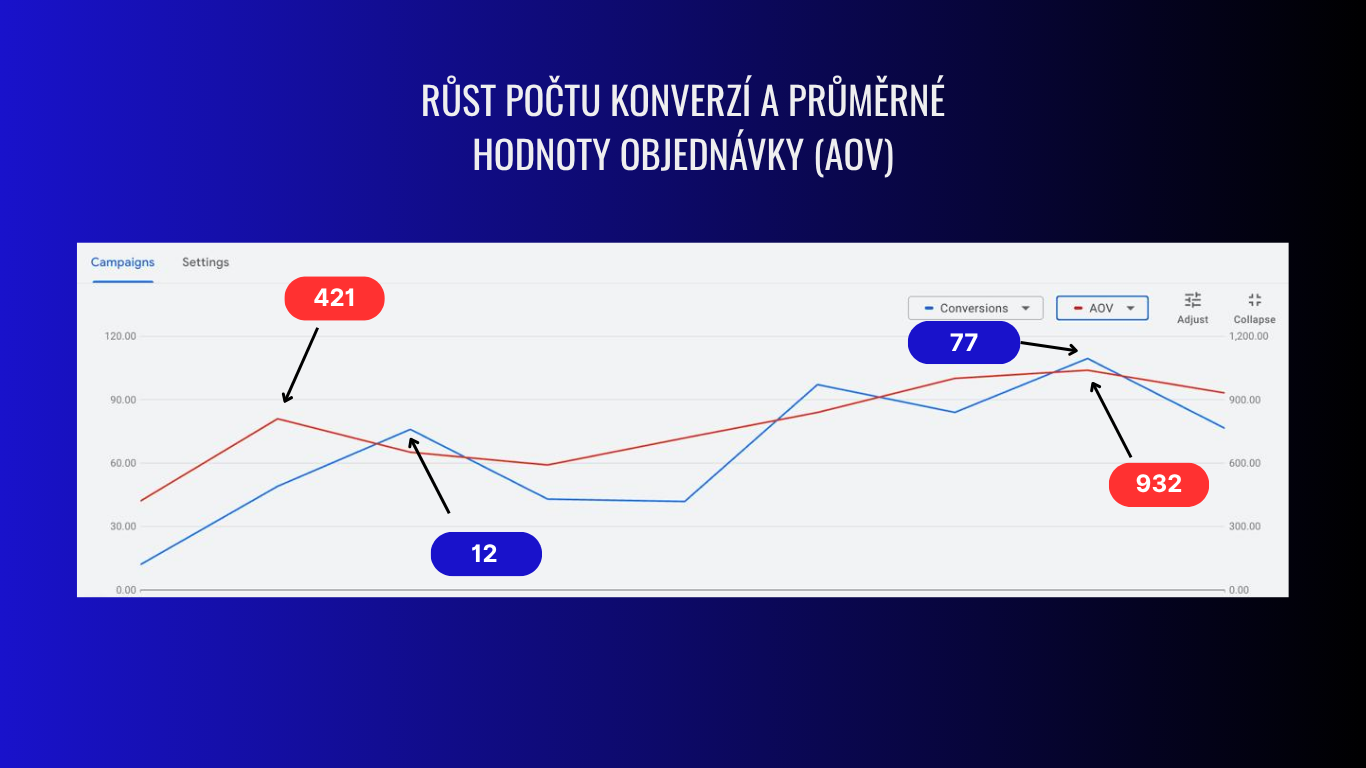
- Orders: from 12 to 77 orders/month
- AOV: from 420 to 932 Kč
Conclusion
You regularly test different approaches — for example how to split the budget between products, how to work with the assortment and how to react to the numbers your campaigns show you.
In our example you could see that even a small change — such as excluding cheaper products — can bring a significant shift in the results. It was not a coincidence, but continuous work with data and a bold decision to try something differently.
If you want to get more out of advertising in the Performance Max or Shopping format, start with these three steps:
- Measurement — set up your analytics correctly.
- Segmentation — split your assortment by performance.
- Optimisation — adjust the campaigns regularly according to real data.
What can you do now?
Using the guides we have created, analyse the state of your e-shop and gradually work on improving the assortment, the average order value and the advertising campaigns.
Guides:
- How to set up analytics and verify that it works? — (step by step, just repeat)
- How to increase the average order? — (main principles and examples)
- How to work with the assortment in an e-shop?
- Analysis of your items against the competition?
- Analysis of the performance of the advertising campaigns.
Kids' goods e-shop — 14× more orders
A kids' goods e-shop case: 1000 SKUs in a single campaign, the assortment split into five groups, two campaigns and ROAS from 150 % to 450 %.
From 80 to 240 orders in 4 months
A printer-cartridge e-shop case: fixing the analytics, splitting the assortment into five groups and rebuilding the campaign structure.
How we tripled an e-shop's revenue in 2 months
We described how our method multiplied an e-shop's revenue and at the same time improved the efficiency of its Google Shopping advertising.
How effective assortment management lifted ROAS from 243% to 650%
Scaling e-shop sales through assortment analysis in Google Ads: the case of a cosmetics store.
How we burned 895.000+ Kč on Google Ads in an e-shop
How to find out where you're burning your Google Ads budget in your e-shop. A detailed guide.
Nine stores joined in August 2025. A year later, five are still running — here are their numbers
Ukrainian cases without the showcase: we take everyone who joined in a single month a year ago. Four improved their return, one stopped advertising. With methodology and honest caveats.