From 80 to 240 orders in 4 months
A printer-cartridge e-shop case: fixing the analytics, splitting the assortment into five groups and rebuilding the campaign structure.
An e-shop with a smaller budget, focused on orders and with loyal customers.
Even we weren’t sure whether we could move the results — but we gave it a try.
How it turned out and what played a part in it, you will find out in the article.
About the e-shop
A printer-cartridge e-shop (Czech Republic)
- Category: Printer cartridges / Toners
- Size: growth from 30–50 to 50–400 orders per month
- Assortment: 400 SKU
This case is exceptional for us. We usually don’t take on projects like this.
Winning orders is essential for the client, he has a well-set-up customer-retention process. That is exactly why we designed our algorithms with this key goal in mind.
The start and the problems with analytics
Originally the campaign structure was very simple — it contained only one advertising campaign, and on top of that the analytics had not been set up correctly.
The analytics were handled by a paid plugin which, however, provided inaccurate data. We had a large discrepancy in order value (sometimes as much as 40x).
Then, based on our algorithm, we split the assortment and found that some products perform significantly better than the rest, so we separated them into standalone segments.
Results and growth
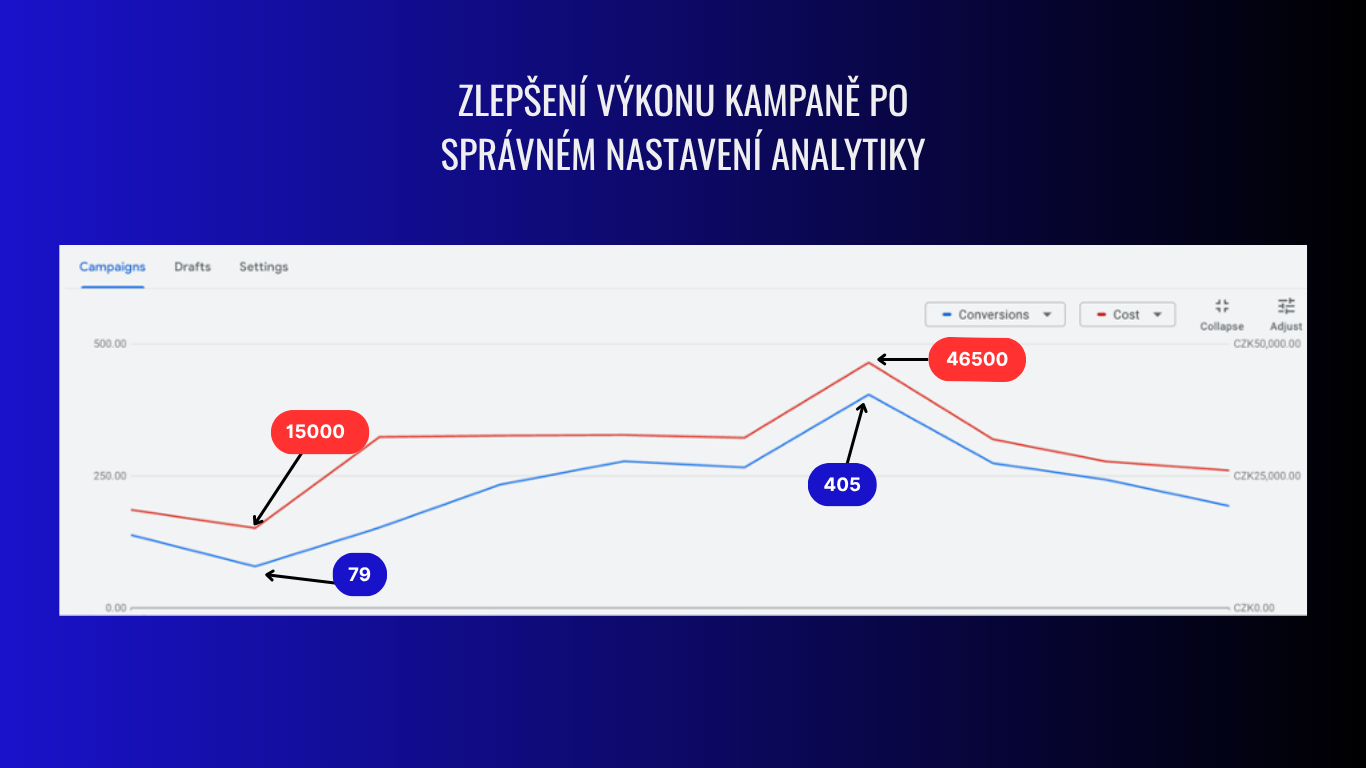
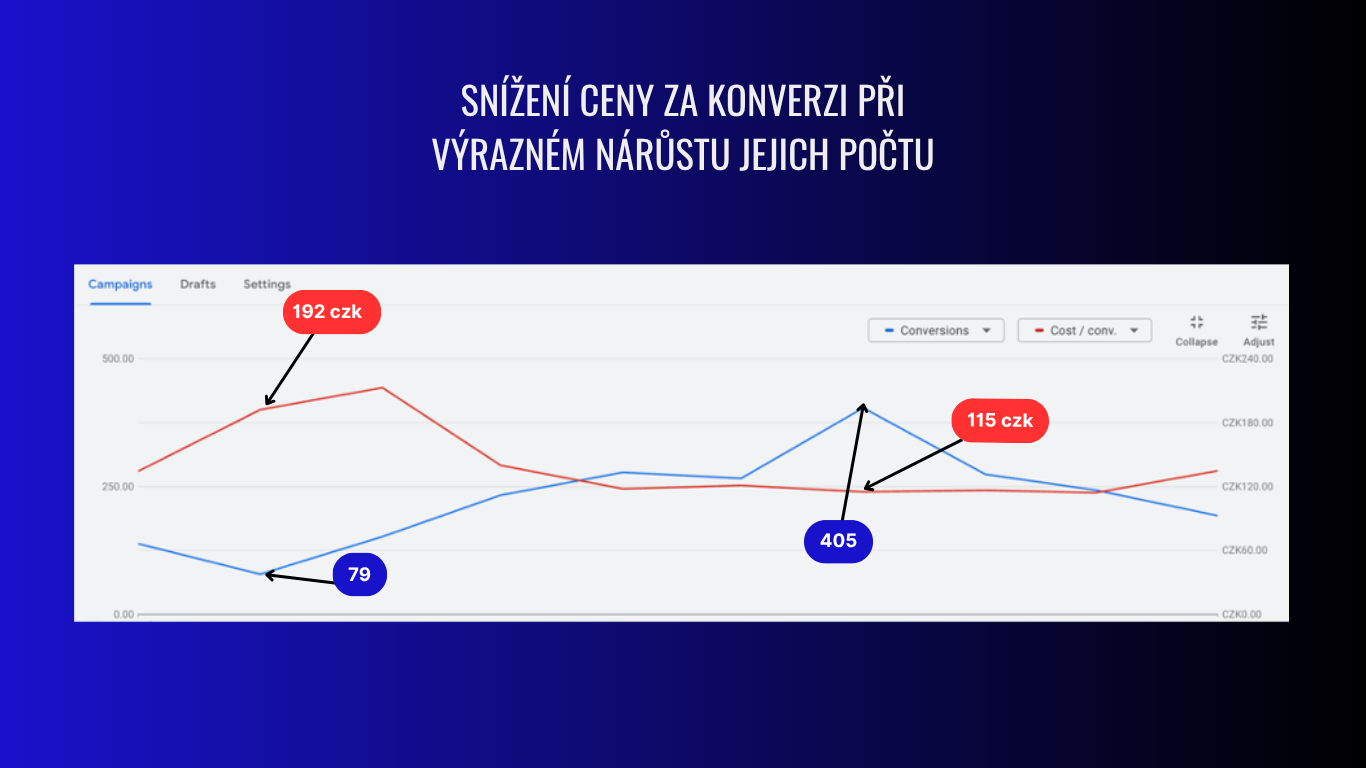
After several repeated adjustments we stabilised the cost per conversion and at the same time increased the number of conversions from 80 to 400 per month in season.
After Christmas we stabilised sales at the level of 200-250 orders per month.
Key steps:
- Setting up the analytics
- Product analysis and segmentation
- Structure of the advertising campaigns
- Optimisation
Setting up the analytics
This is one of the most fundamental steps when working with Google Ads. If you have data transfer from GA4 set up, we recommend replacing it with the conversion code from Google Ads — data loss of up to 20 % happens often.
You will find a universal guide to setting up analytics here.
In this particular case the situation was more complicated — the client was using a paid plugin and was convinced that everything worked correctly.
During our check, however, we found that the data did not add up — the average order value sometimes climbed to 40 times the actual amount.
We therefore decided to set up another two conversions in order to find out where the error was. After a week we compared the results and kept only the one that showed realistic data.
This is a very important step, because with Google you need to work on the basis of accurate and trustworthy data.
In general, with Shoptet and similar e-shop platforms there usually are no problems with analytics, but when it comes to a smaller vendor or an open source solution, everything needs to be thoroughly checked.
Product analysis and segmentation
Based on the algorithm we analysed every product in the ads and split the assortment into five groups:
- Bestseller
- Potential Bestseller
- Zombie
- Loser
- New arrivals
This step is fundamental for distributing the budget effectively based on the performance of individual products.
Products that statistically generate sales and achieve good efficiency are the ones we want to support by increasing impressions, clicks and orders.
Conversely, items that only consume budget without bringing the desired results get a lower priority and a limited budget.
Structure of the advertising campaigns
Based on the segmentation we split the assortment into two campaigns:
Campaign no. 1
Goal: maximise the number of conversions and revenue at the target ROAS
Segments: Bestseller, Potential bestseller and New arrivals.
Contains products that sell well and new goods for which we don’t yet have enough data, but where we want to find new Bestsellers.
Campaign no. 2
Goal: reduce the cost of products from the Zombie and Loser groups so that they sell profitably.
Segments: Loser, Zombie
ROAS at the target value or higher, so costs grow only when the required ROAS is reached.
This way we managed to distribute the budget more effectively, uncover new bestsellers, increase revenue and improve the overall efficiency of the advertising campaigns.
After reaching more than 120 conversions per month we expanded the structure slightly and added another two campaigns.
We found that a certain segment makes up the majority of the orders and on top of that achieves the best efficiency. That is why we assigned this segment its own separate budget, while for the remaining segments we split the budget separately.
Optimisation
Besides splitting the products into campaigns itself, we tested various ways of optimising.
We developed an algorithm that helps keep performance stable:
- Make changes at most once every 3–4 days
- Change CLA by at most 10 %
- Change the budget by at most 30 %
- Maximum number of assets in one asset group
The reason is that Google Ads is a combination of:
- demand
- statistics
- data
- a self-learning algorithm.
Any significant change causes larger deviations in the results:
- Increasing the budget raises the number of clicks and impressions, and therefore the data flow as well
- Changing ROAS or CPA adjusts the conditions under which the budget is spent
- Changing the number of products in the campaigns affects the volume of key queries.
A big change can lead to the algorithm being retrained.
The most important thing is that most of the optimisation and product segmentation processes run automatically.
Results:
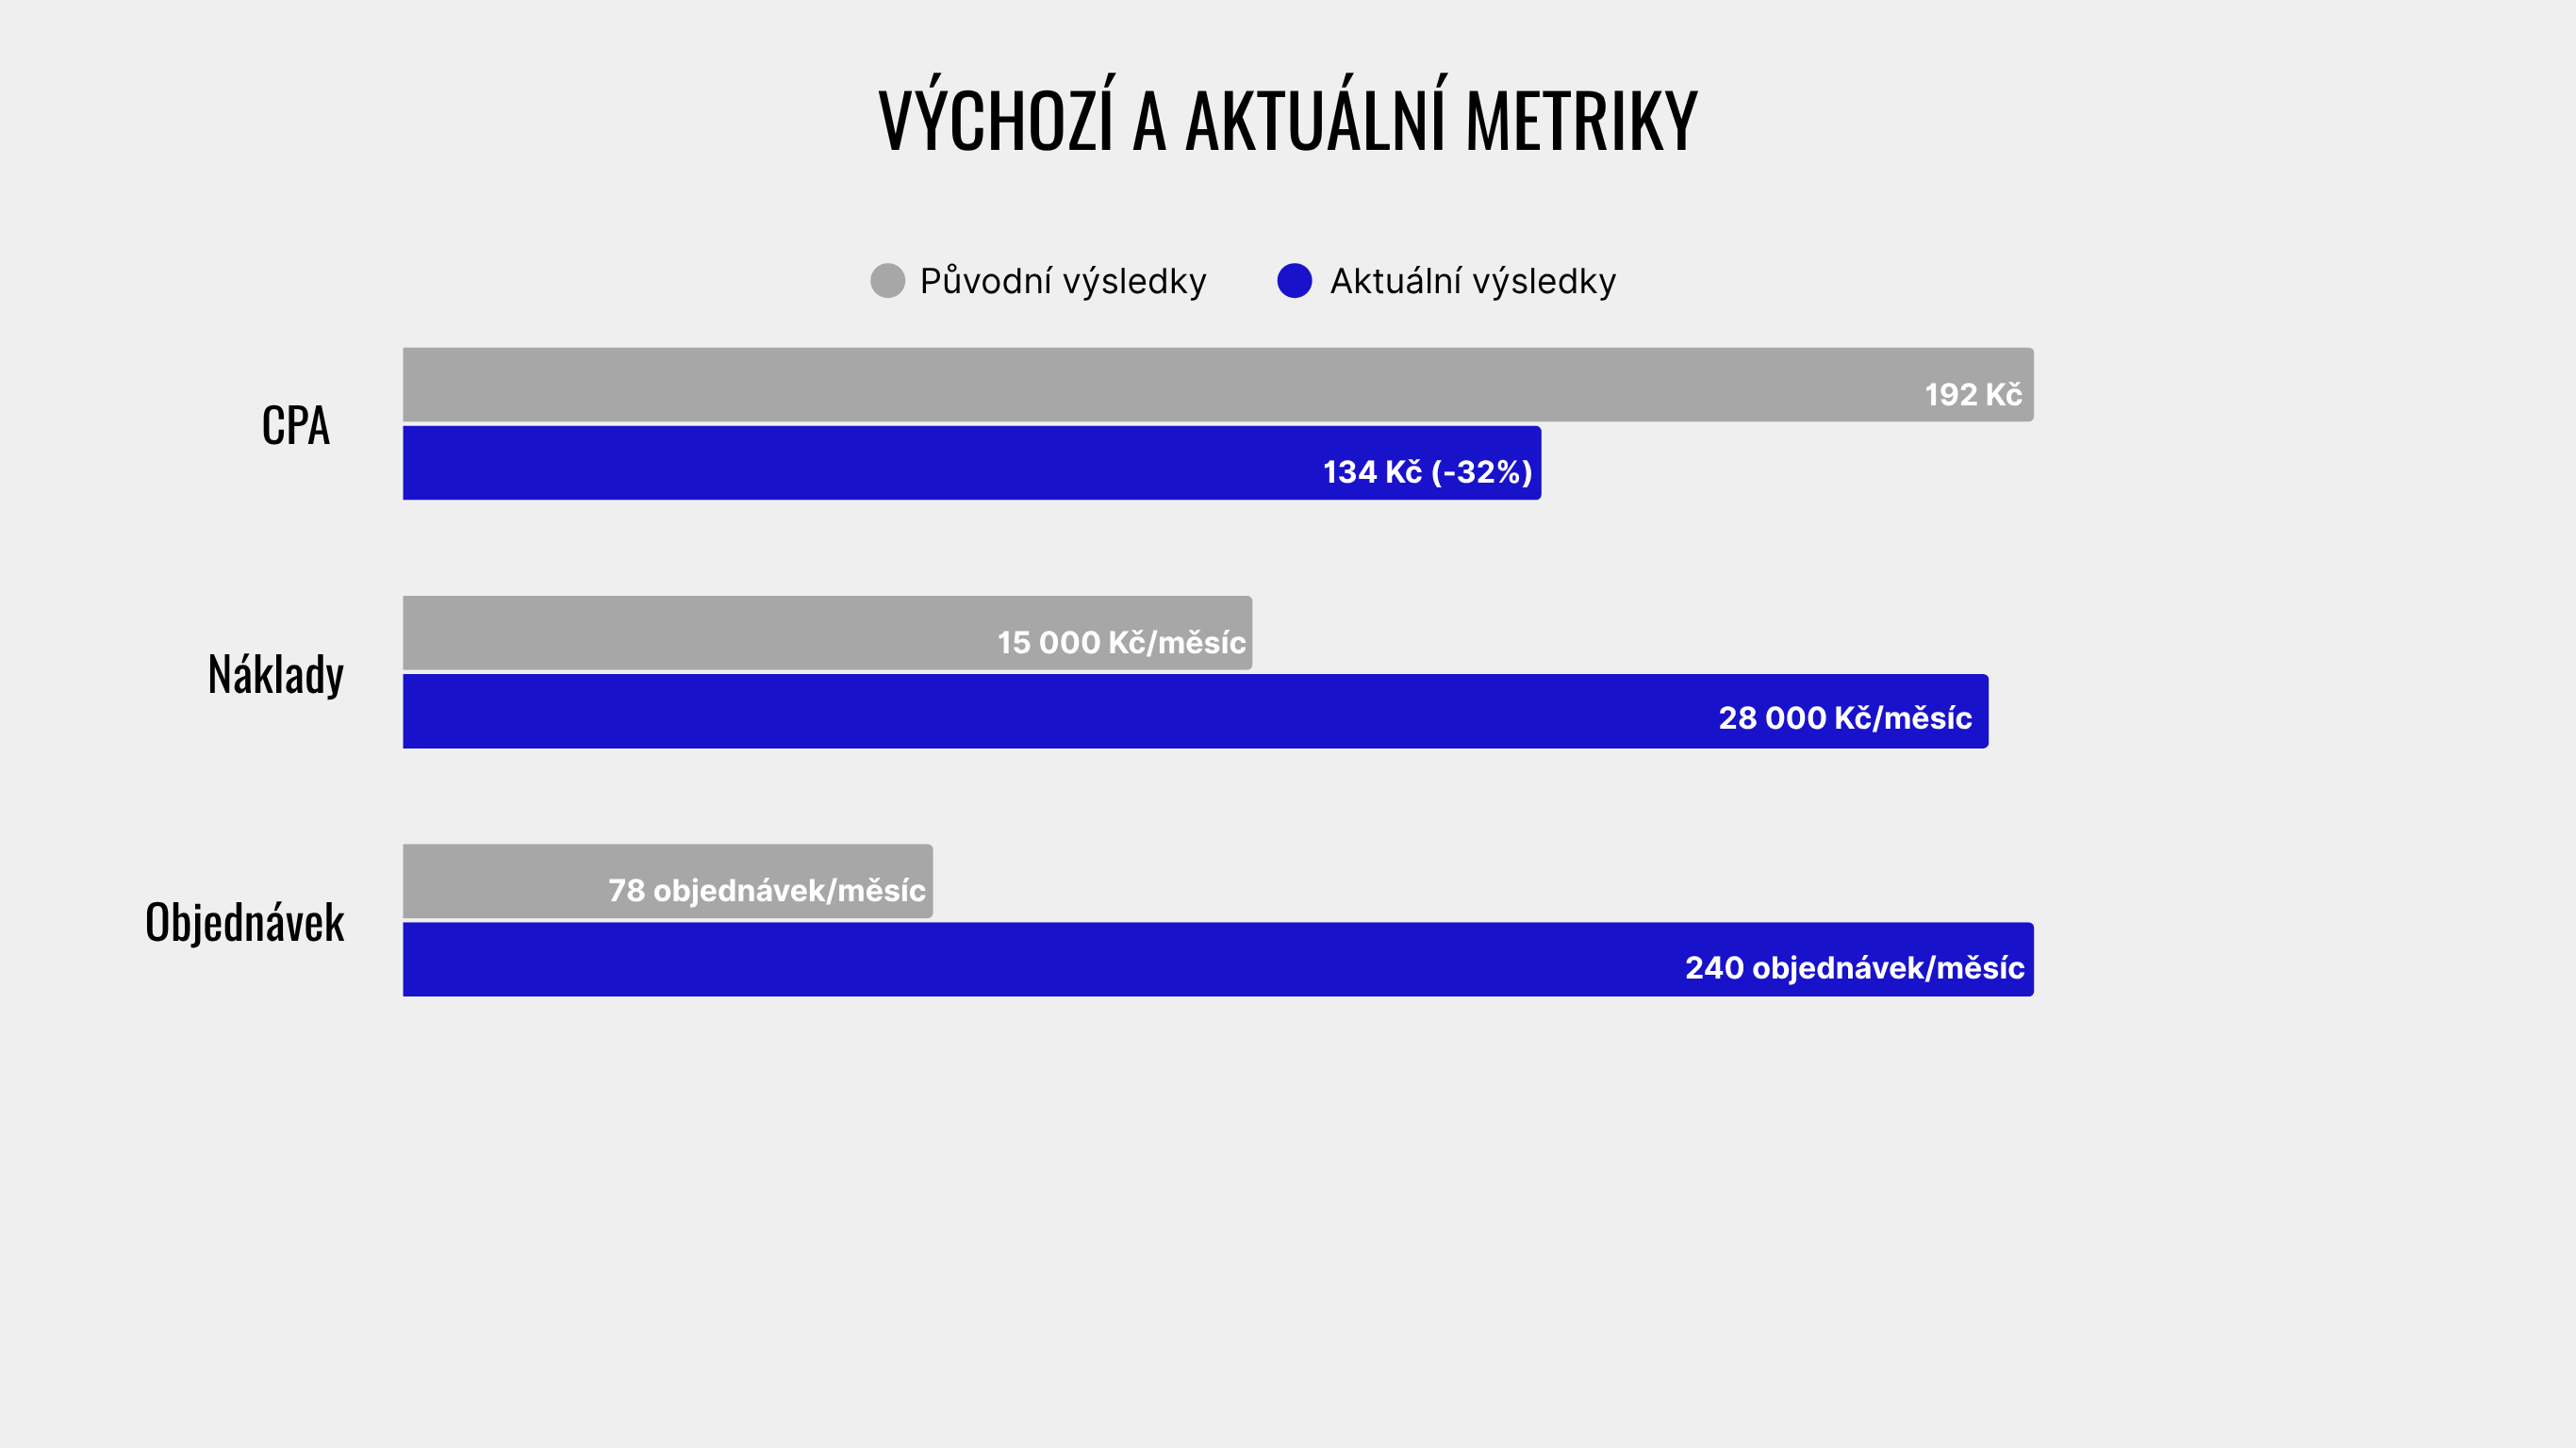
- Number of orders: from 78 to 240 (+208 %)
- Budget: from 15,000 to 28,000 (+ 186 %)
- Cost per order: from 192 to 134 Kč (-32 %)
Conclusion and next steps
Online selling is not a matter of chance. The key is to have a clear picture of your own e-shop’s economics — to know which products generate profit, which merely drain the budget, and what actually brings results. That requires accurate data, its regular analysis and the ability to make decisions based on it.
It is not enough to just launch campaigns. It is essential to track the performance of every product and segment, to have the analytics set up correctly, and to allocate the budget where the contribution is greatest.
In the following chapters we will look at examples of e-shops of various sizes and segmentations and show specific metrics and strategies that match their real needs.
What can you do now?
Using the guides we have created, analyse the state of your e-shop and gradually work on improving your assortment, your average order value and your advertising campaigns.
Guides:
- How to set up analytics and verify that it works? — (step by step, just repeat)
- How to increase the average order? — (main principles and examples)
- How to work with the assortment in an e-shop?
- Analysis of your items against the competition?
- Analysis of advertising campaign performance.
ROAS from 111 % to 560 %: a home accessories e-shop
A small home-accessories e-shop case: splitting the assortment into five groups, two campaigns by performance and excluding products under 300 Kč.
How effective assortment management lifted ROAS from 243% to 650%
Scaling e-shop sales through assortment analysis in Google Ads: the case of a cosmetics store.
Kids' goods e-shop — 14× more orders
A kids' goods e-shop case: 1000 SKUs in a single campaign, the assortment split into five groups, two campaigns and ROAS from 150 % to 450 %.
Nine stores joined in August 2025. A year later, five are still running — here are their numbers
Ukrainian cases without the showcase: we take everyone who joined in a single month a year ago. Four improved their return, one stopped advertising. With methodology and honest caveats.
How we tripled an e-shop's revenue in 2 months
We described how our method multiplied an e-shop's revenue and at the same time improved the efficiency of its Google Shopping advertising.
How we burned 895.000+ Kč on Google Ads in an e-shop
How to find out where you're burning your Google Ads budget in your e-shop. A detailed guide.