How we burned 895.000+ Kč on Google Ads in an e-shop
How to find out where you're burning your Google Ads budget in your e-shop. A detailed guide.
Simple steps that will help you save tens/hundreds of thousands of crowns.
The thing 98 % of e-shops don’t do.
If you run an online store and advertise on Google Ads, then this article will definitely help you. We’ll explain simple steps that absolutely anyone can take and stop burning your budget today.
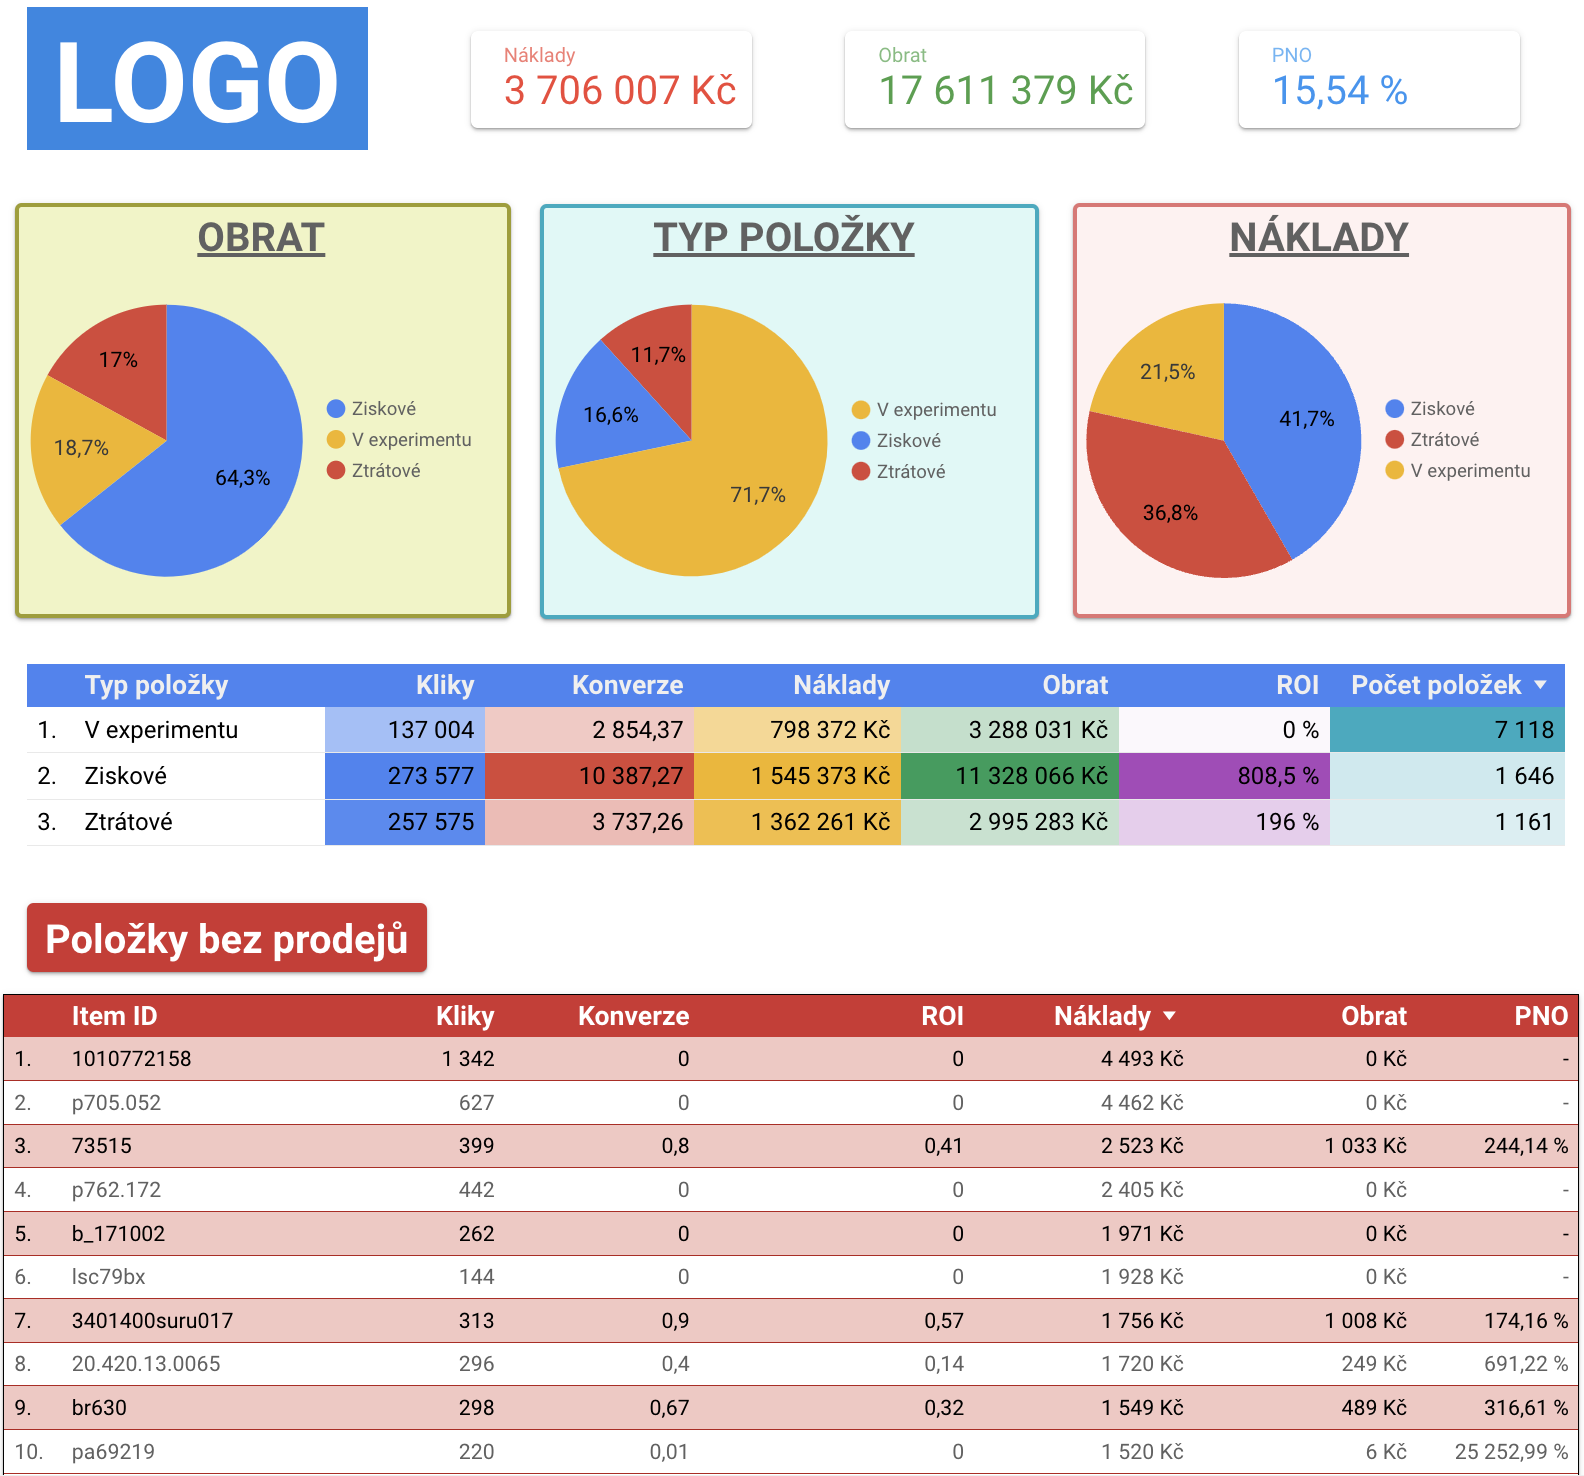
Let’s get straight to the point. First of all we need to analyse the assortment in the advertising. We’ve made a sample dashboard (.pdf) — if you like, we can prepare a similar one for you completely free of charge.
To make the decisions easier, I split the items into three groups:
- Profitable (meeting the targets)
- Loss-making (not meeting the targets)
- In experiment (didn’t get enough budget)
Step one — items with no sales
You need to find out which items have already been tested but brought no sales at all. For us an item is tested if we’ve spent on advertising at least 400,- Kč.
In total we found we have 319 such items.
The total budget we spent on them: 215.431 Kč
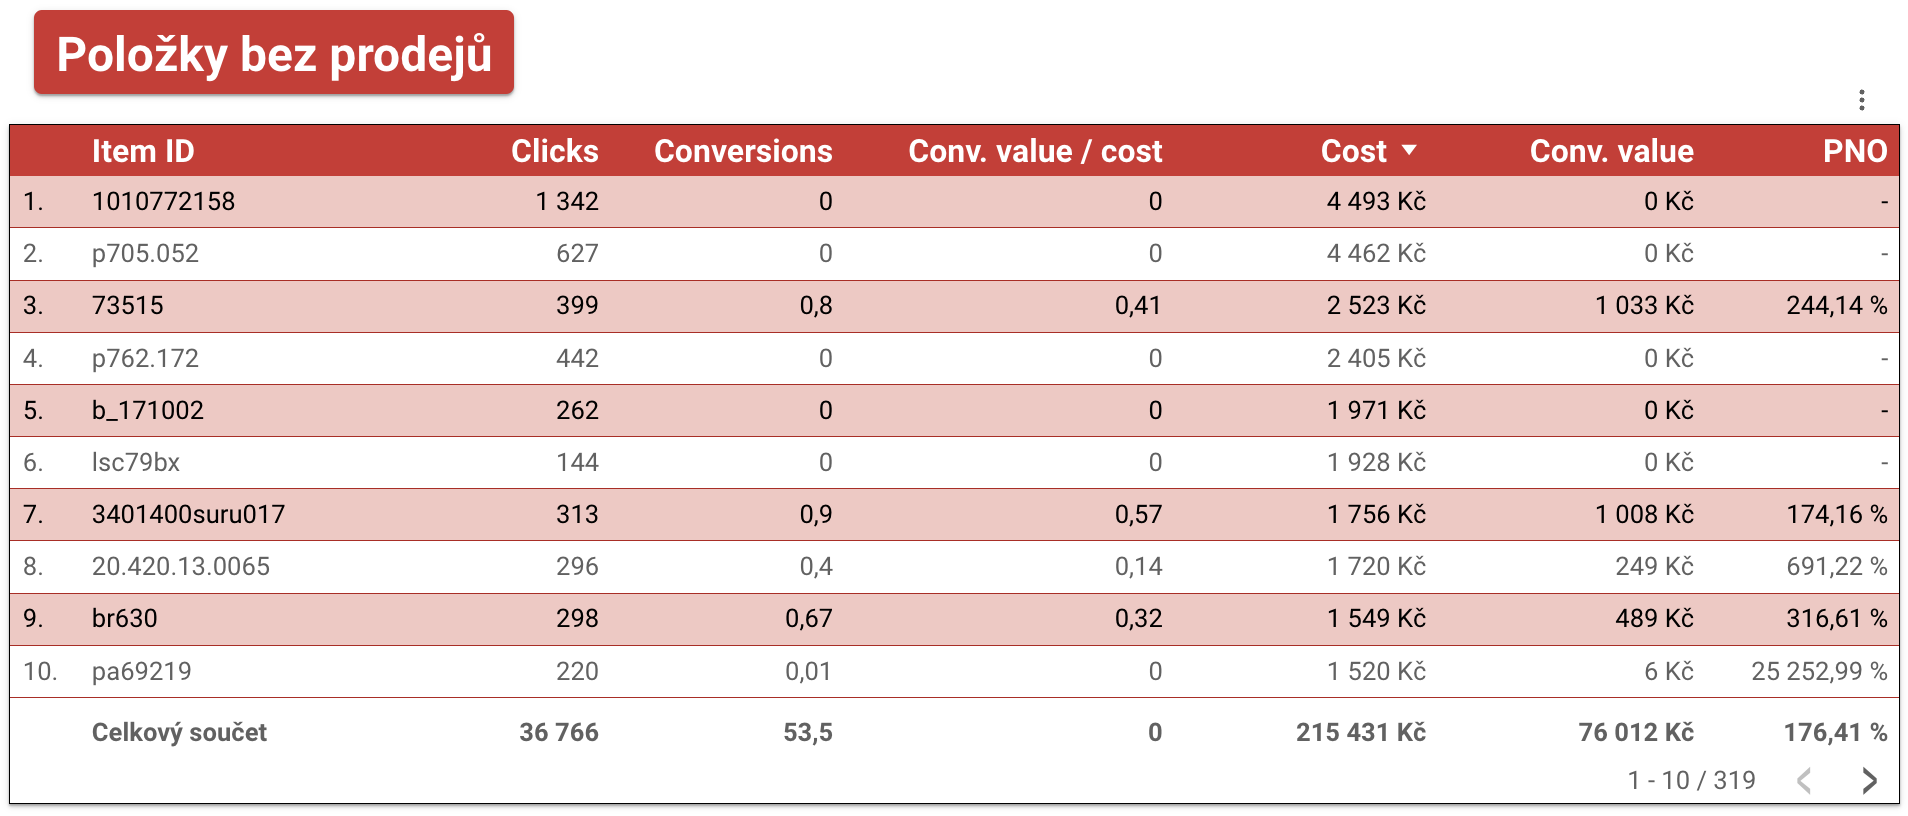
There was no way to say in advance whether these items would sell. Nevertheless, we could have spent 2-3 times less on testing them and reallocated the budget to other products sooner.
That’s why we made ourselves a rule:
An item is tested if we’ve invested at least 400,- Kč into promoting it on Google Ads.
Why did we decide it this way?
We started from the margin and the average order. Our average order is 1150,- Kč and our margin is about 35 %. Which means that from 1 order we make a profit of: 1150 * 35 % = 402,5 Kč. If that amount has been spent on any item in the assortment and it had no sales, we put it into Loss-making items.
These are only our rules; in your case you can set different conditions, but they should match your economic situation. For example:
- Some e-shop owners have a rule to spend 2-3х the margin from the item’s sales. For us that’s too much;
- We’ve also come across a rule based on the average cost-to-revenue ratio. In most cases it leads to a drop in sales, even though the cost-to-revenue ratio really does improve.
Step two — unprofitable sales
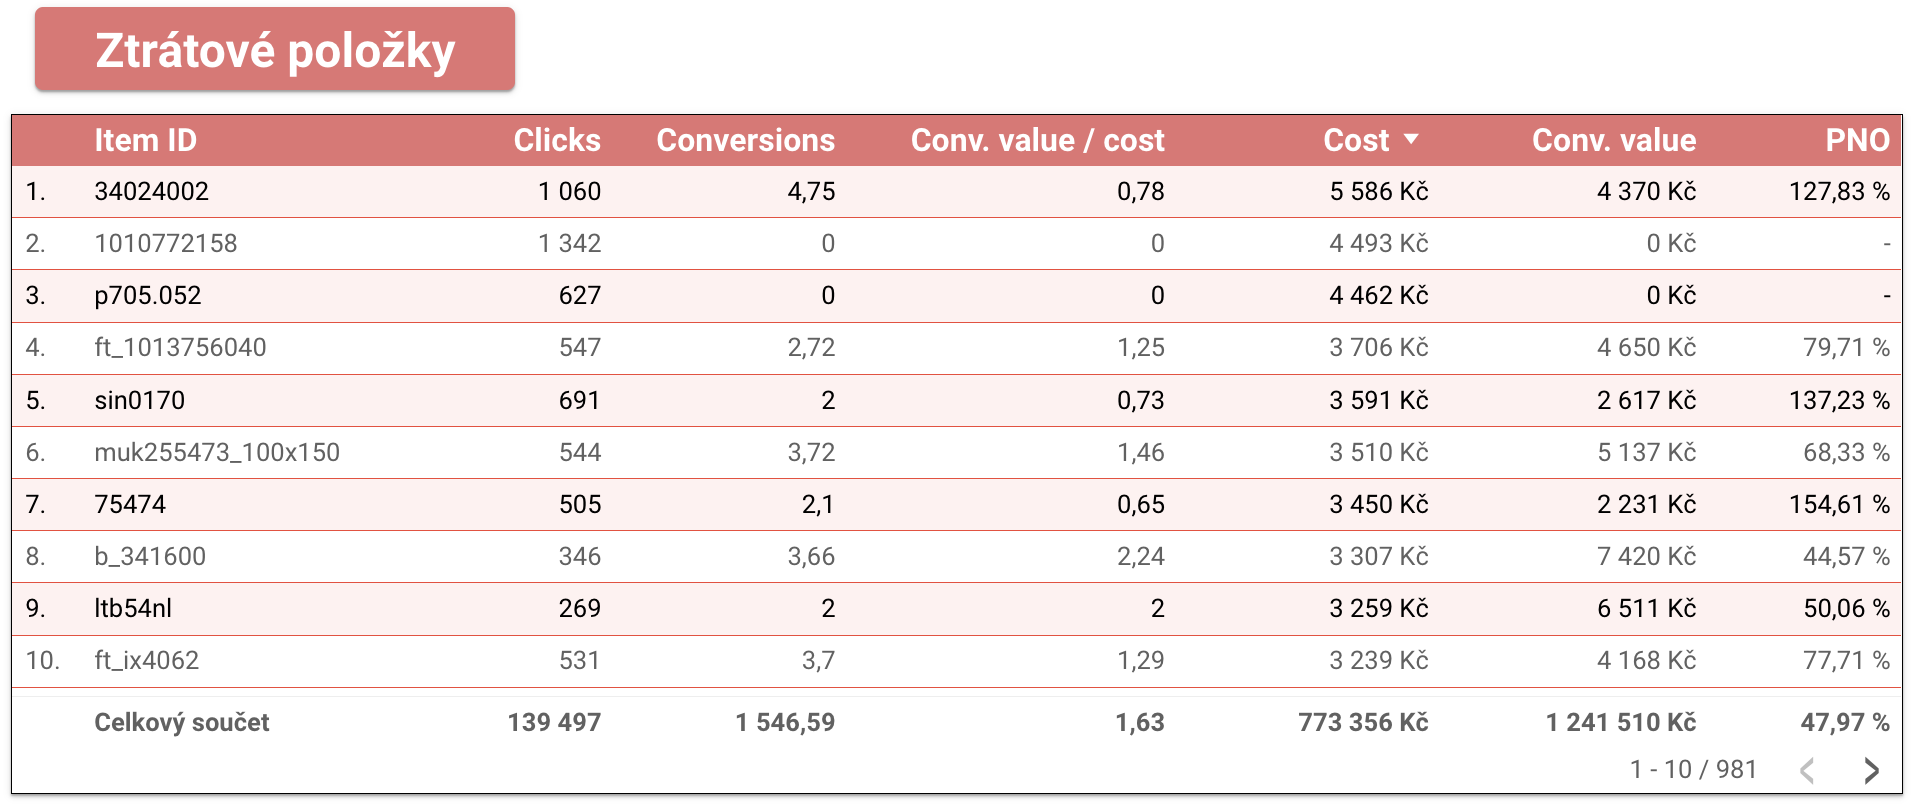
There are sales, but with no profit or at a loss.
At this stage we invested:
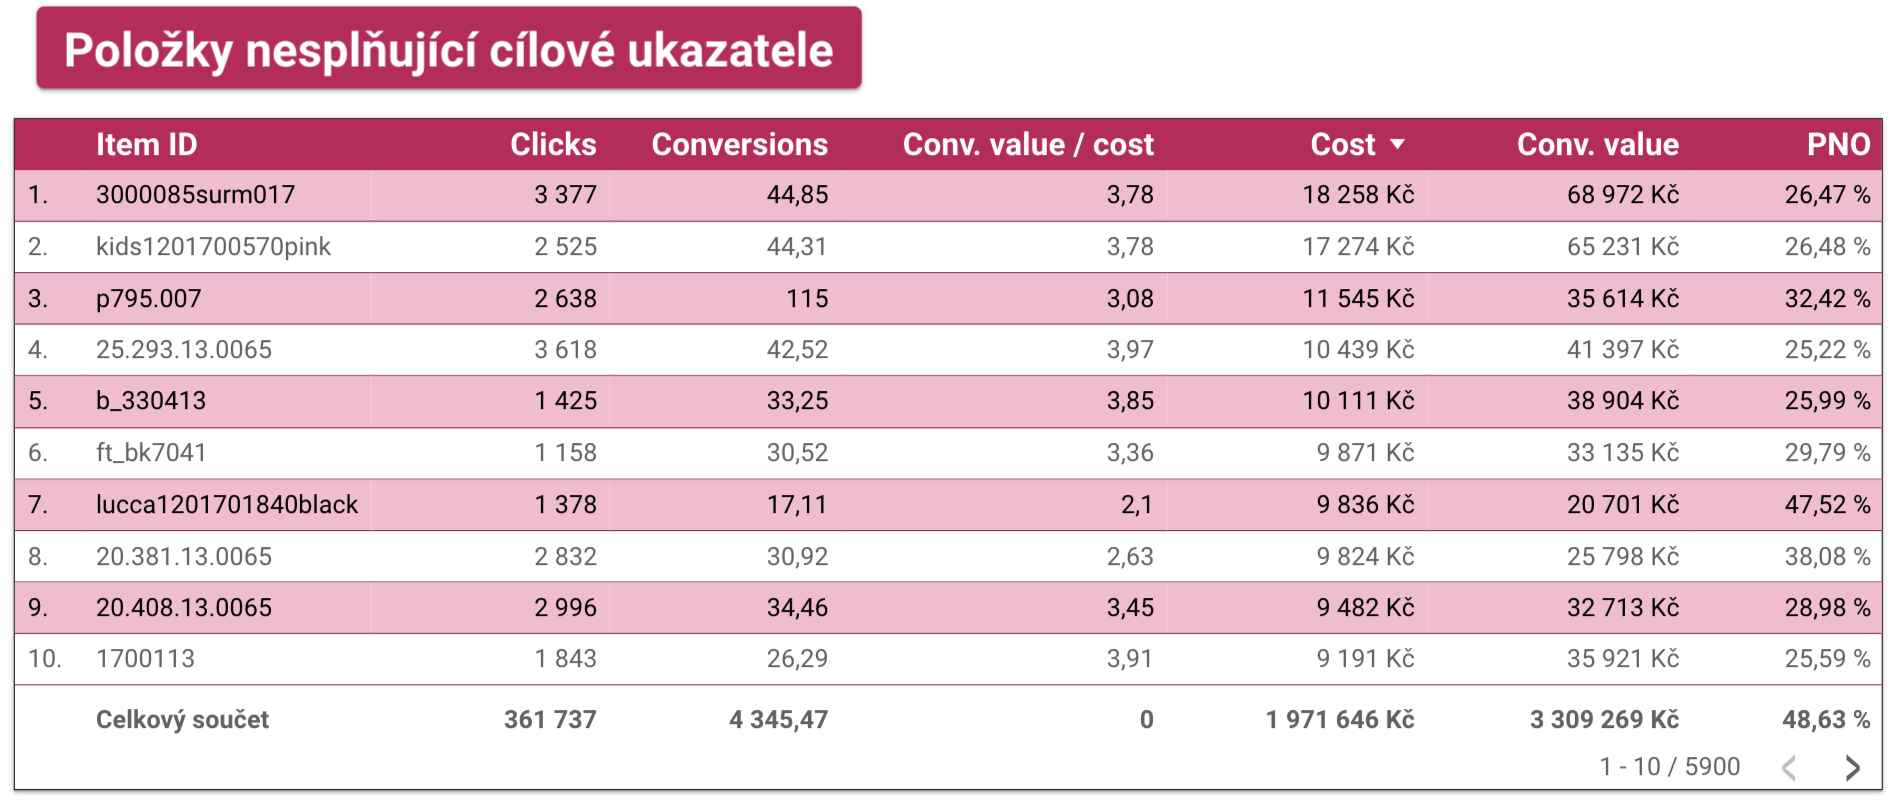
1.971.646 Kč.
In total these items brought us revenue of 3.309.269 Kč.
That’s why we created the following algorithm:
- fewer than 3 sales a month - we assign the label: Loss-making
- more than 3 sales a month requires a detailed analysis. You can see there’s demand. And there are many ways to increase its efficiency.
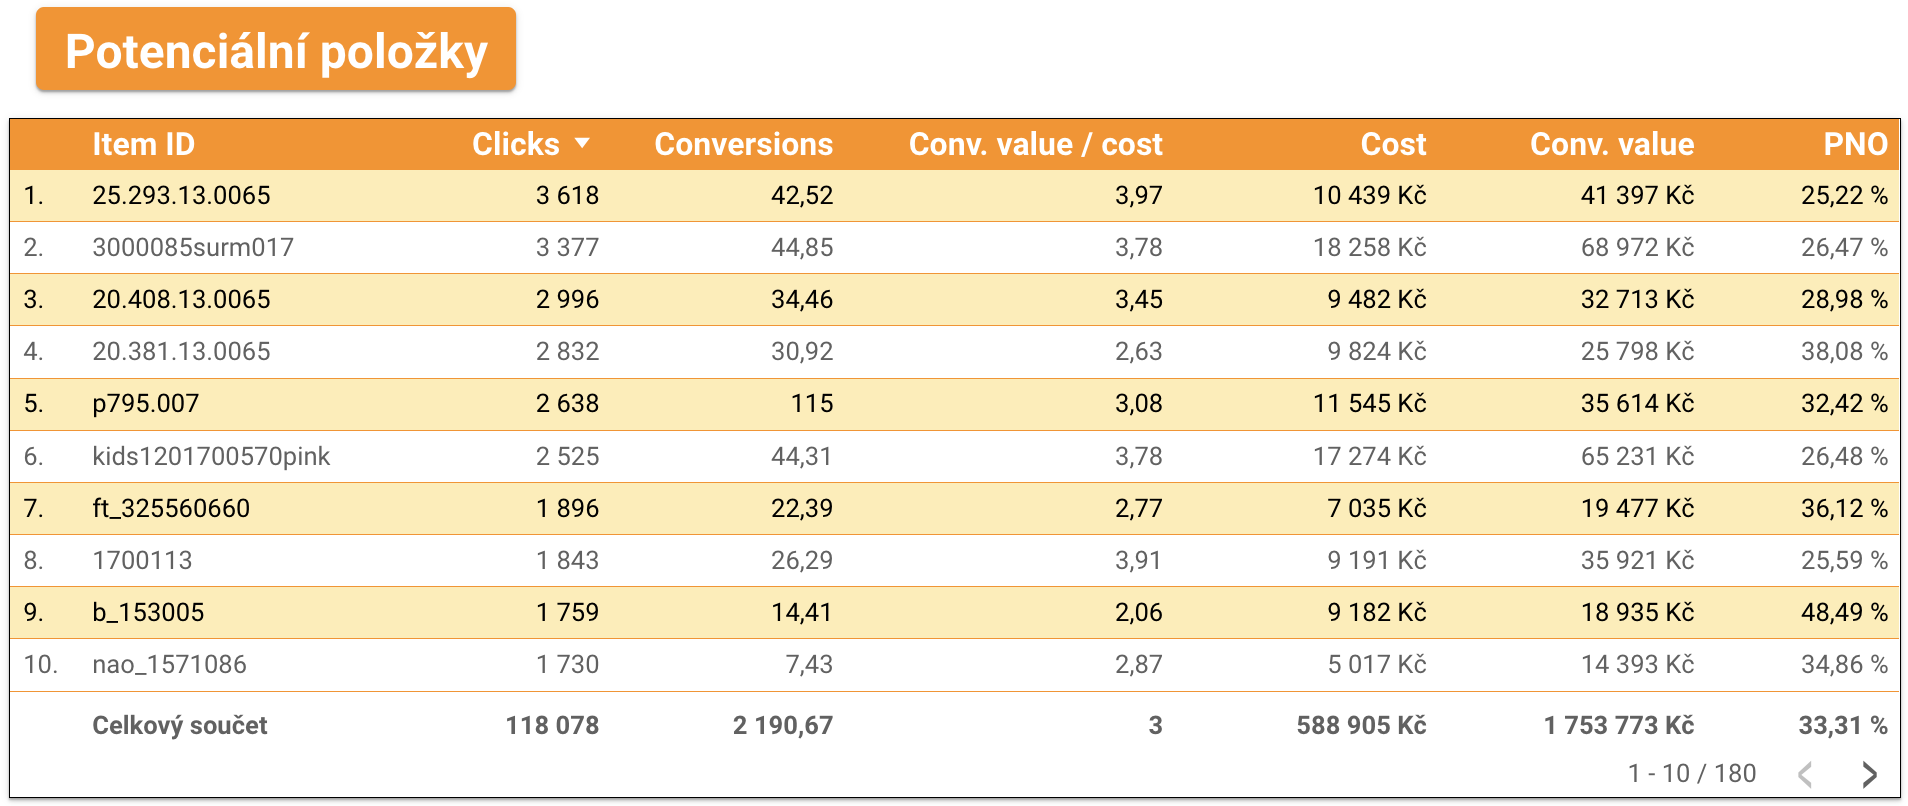
Here we found 180 items on which we spent: 588.905 Kč.
And we got revenue of: 1.753.773 Kč. Cost-to-revenue ratio: 33 %.
If we put it all together, we have the following situation:
- Out of 5900 loss-making items, 180 generated more than 50 % of the revenue;
- While these items make up about 30 % of the total costs;
- And the cost-to-revenue ratio is double our average one.
This suggests that these products need our attention. They have demand on the market, they sell well, but the efficiency is weak.
Interested in how to increase efficiency? You’ll find a few ideas in our article here.
Step three — to promote or not to promote?
We asked ourselves a question:
Which assortment SHOULDN’T we promote right from the start?
Our answer: don’t promote products that are bought as an add-on to something.
That means that if we sell phones and offer cases, screen protectors, chargers, stands and headphones alongside them, then only the phones should run in the advertising, because that’s our main product.
We also realised that compared with the competition we sold the add-on products at higher prices and the choice was very limited. That’s why in our case it was worth promoting the phone, not the cases.
Someone else may have cases as their main product, because they have a large choice and good prices. Then it makes sense to focus on the cases.
More examples:
- A printer and ink cartridges;
- A vacuum cleaner and vacuum cleaner bags;
- Kitchenware and small kitchen tools;
- A bike and a phone holder, a light.
The idea is simple: if someone comes to you for a phone, they may buy a case along with it. But if someone comes for a case, it’s unlikely they’ll buy a phone with it. That’s why we kept only the main products — the phones — in the advertising.
If you haven’t excluded the add-on products from your advertising, you can analyse them. Usually such items are loss-making.
In total these are 3 simple steps that will improve the cost-to-revenue ratio and increase sales.
Nine stores joined in August 2025. A year later, five are still running — here are their numbers
Ukrainian cases without the showcase: we take everyone who joined in a single month a year ago. Four improved their return, one stopped advertising. With methodology and honest caveats.
How we tripled an e-shop's revenue in 2 months
We described how our method multiplied an e-shop's revenue and at the same time improved the efficiency of its Google Shopping advertising.
How effective assortment management lifted ROAS from 243% to 650%
Scaling e-shop sales through assortment analysis in Google Ads: the case of a cosmetics store.
Kids' goods e-shop — 14× more orders
A kids' goods e-shop case: 1000 SKUs in a single campaign, the assortment split into five groups, two campaigns and ROAS from 150 % to 450 %.
From 80 to 240 orders in 4 months
A printer-cartridge e-shop case: fixing the analytics, splitting the assortment into five groups and rebuilding the campaign structure.
ROAS from 111 % to 560 %: a home accessories e-shop
A small home-accessories e-shop case: splitting the assortment into five groups, two campaigns by performance and excluding products under 300 Kč.